Impact of a Drama Based Reading Program
Arts Education Conference
Laura St. John, Play in a Book / 16/12/2016
This presentation deck provides an overview on the impact of Play In a Book's drama-based reading program partnerships. It includes information on their program and process, how success is measured, results from 5 different schools, and a curricular example of the program.
Implementing Quality 202 : Data Analysis, Interpretation, and Visualization
Data Analysis, Interpretation, and Visualization
Ingenuity, prepared by Jennifer Benoit-Bryan and Katherine Gean / 05/05/2018
This deck is designed to help build skills for analyzing and interpreting qualitative and quantitative data.
Implementing Quality 202: Coding Worksheet
Data Analysis, Interpretation, and Visualization
Ingenuity, prepared by Jennifer Benoit-Bryan and Katherine Gean / 05/05/2018
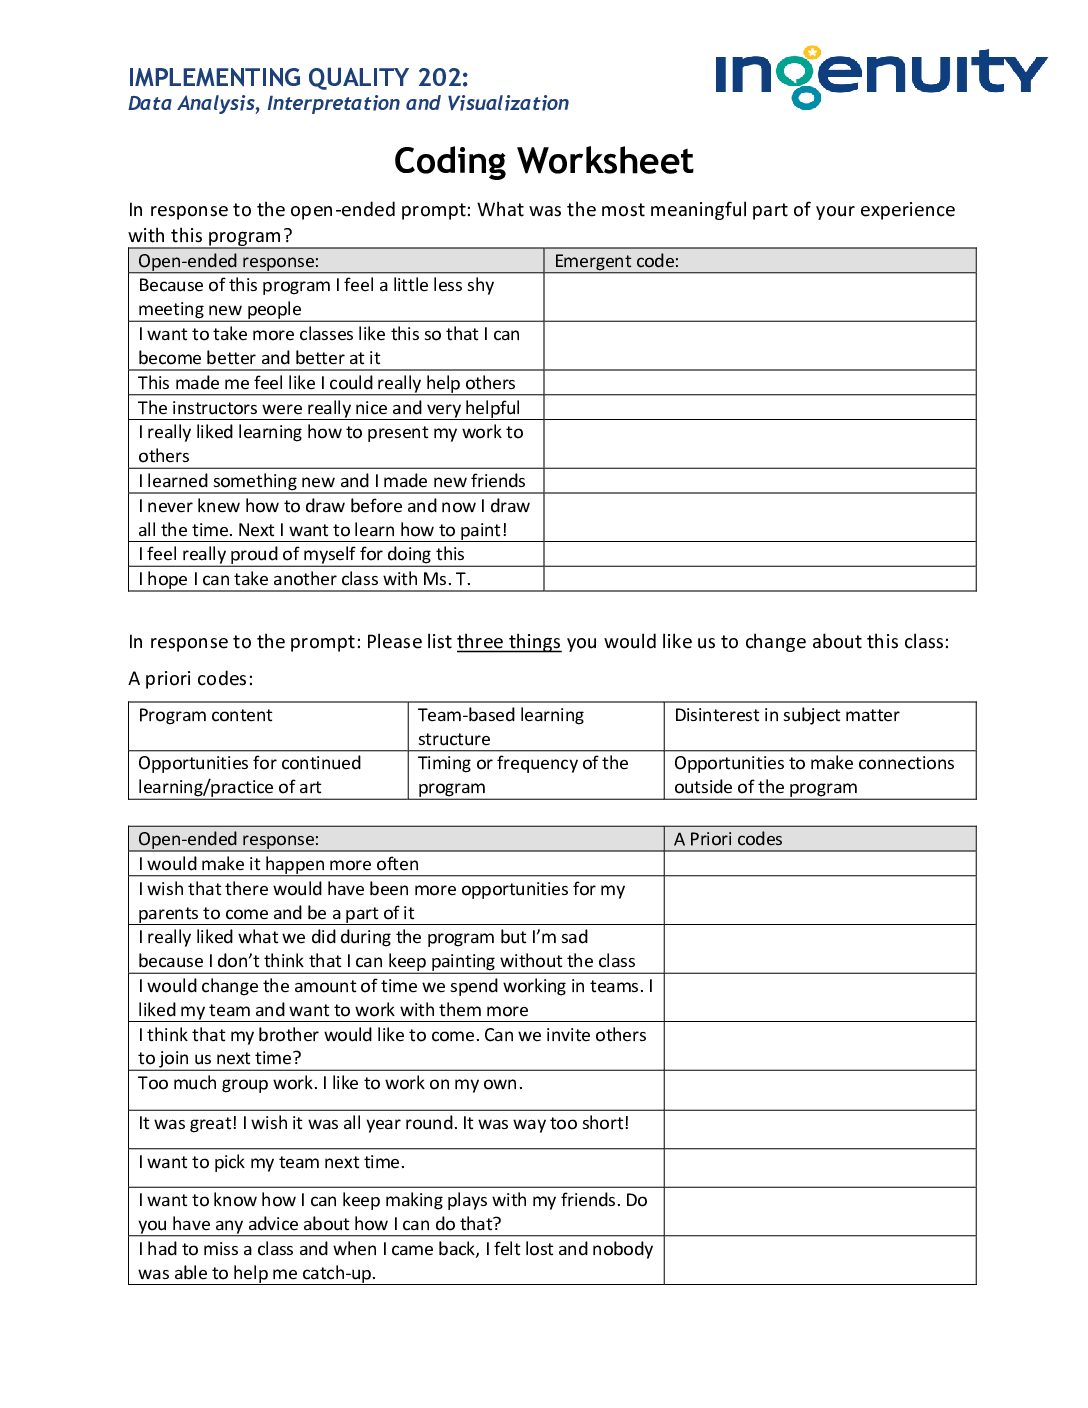
This worksheet will help you take open-ended responses and translate them to more concise words or phrases. This worksheet will also apply a priori codes (coding based on a set of words/phrases already created), to identify and creating a set of codes based on what’s in the data (emergent).
Implementing Quality 202: Data Analysis, Interpretation, and Visualization
Data Analysis, Interpretation, and Visualization
Ingenuity, prepared by Jennifer Benoit-Bryan and Katherine Gean / 05/05/2018
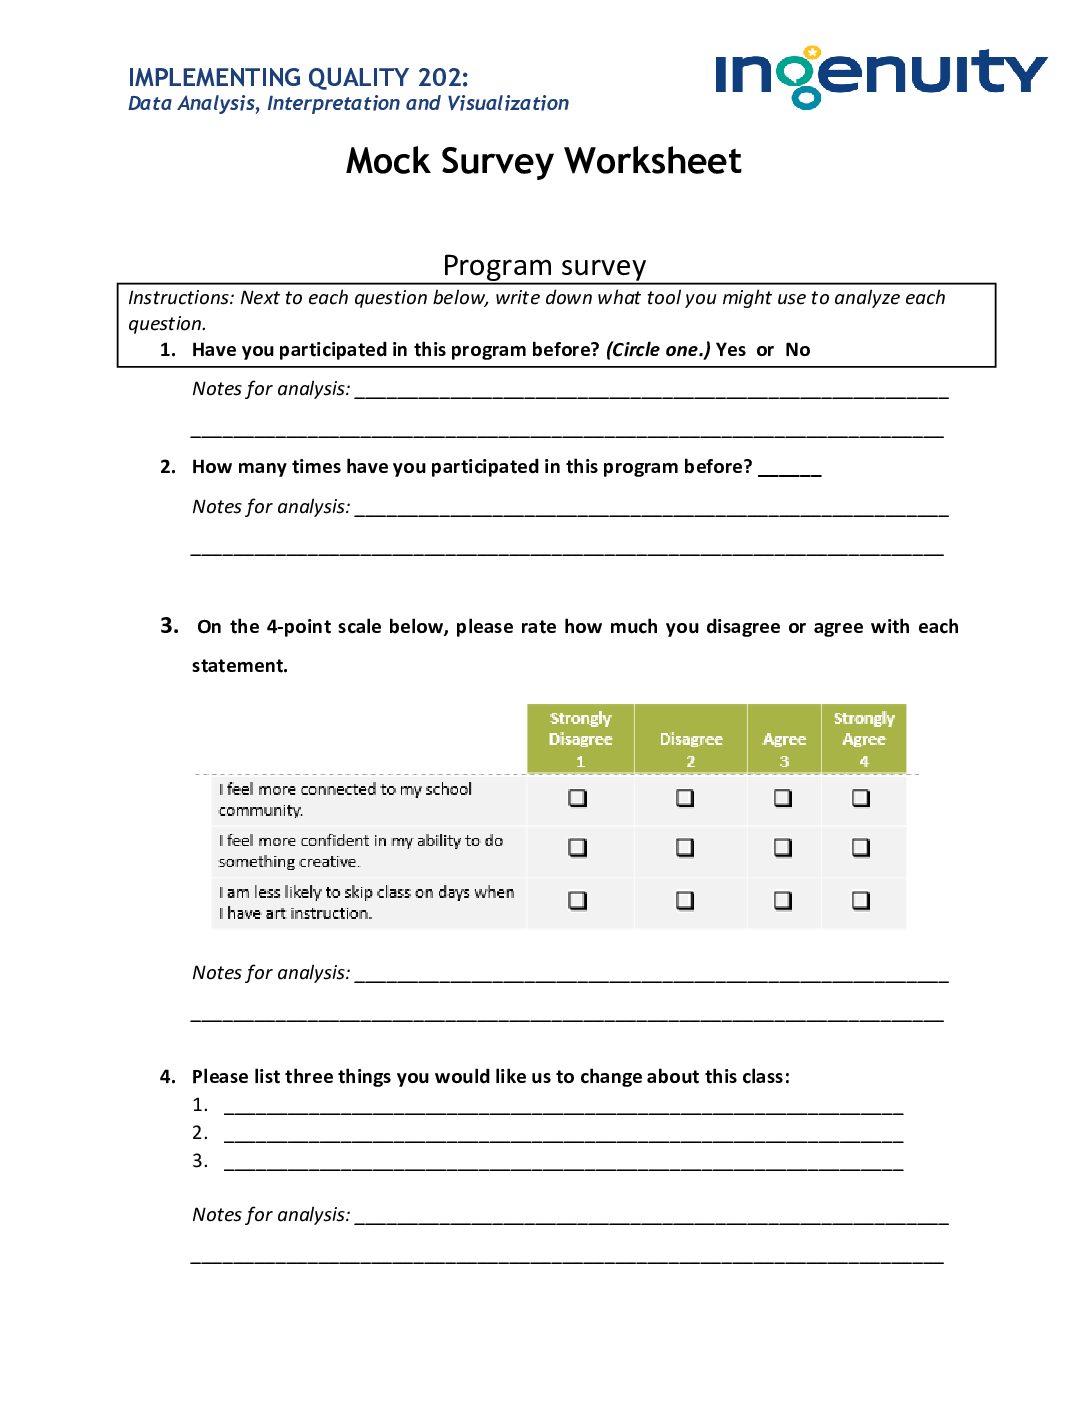
This template provides an example of a program survey and corresponding questions.
Implementing Quality 202: Data Analysis, Interpretation, and Visualization
Data Analysis, Interpretation, and Visualization
Ingenuity, prepared by Jennifer Benoit-Bryan and Katherine Gean / 05/05/2018
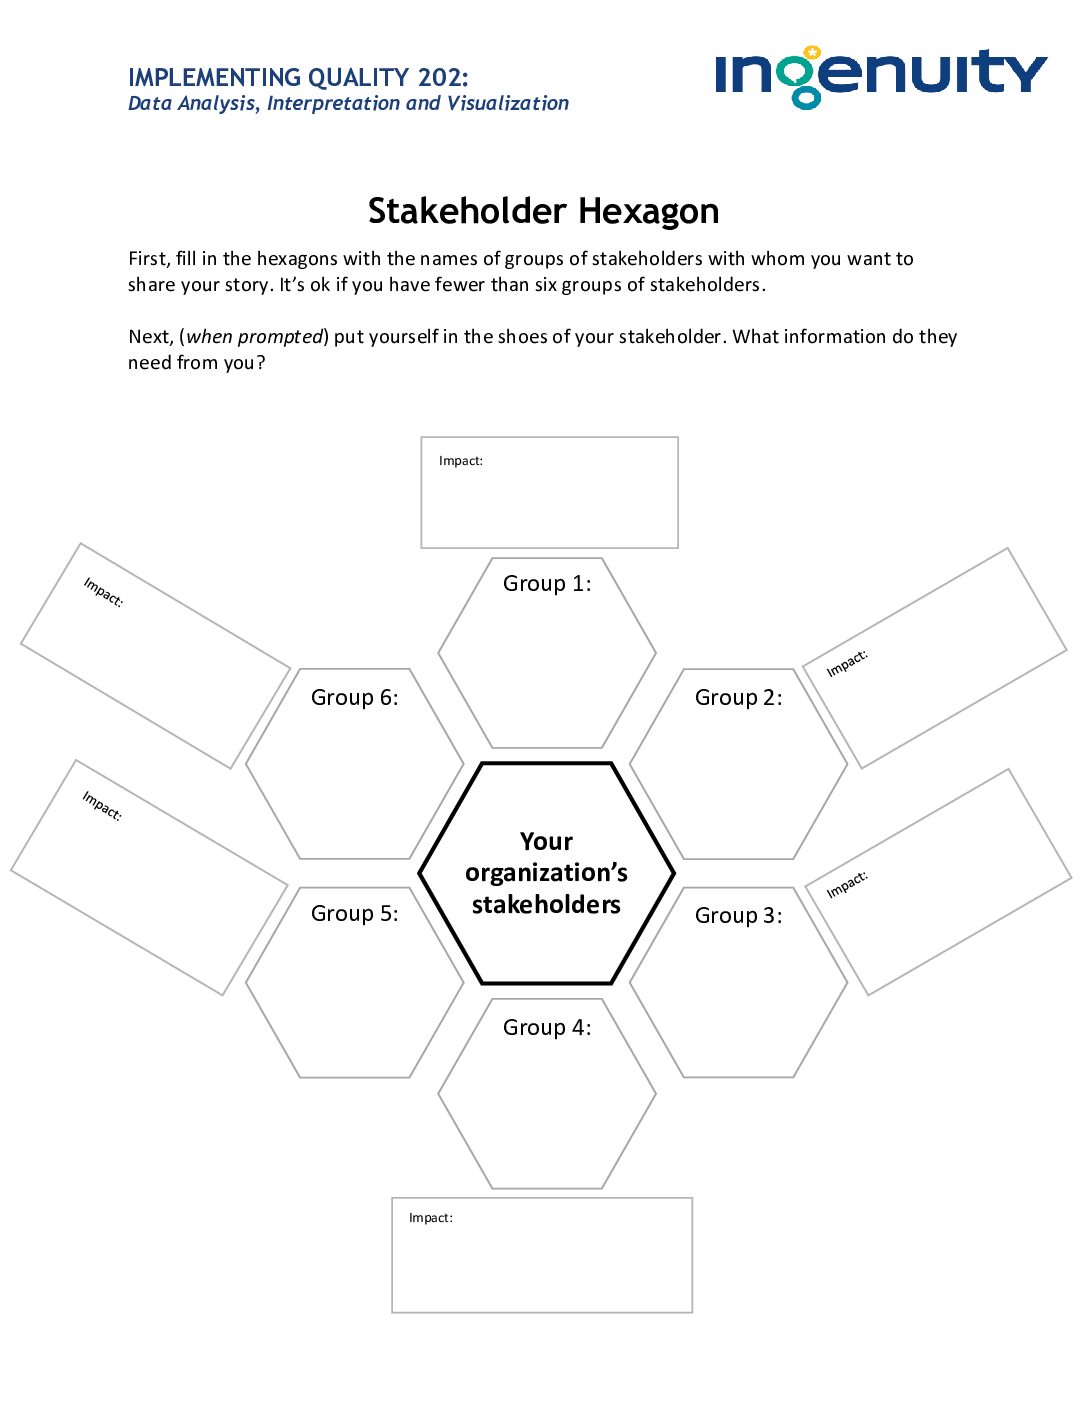
This worksheet provides a visualization and tool for mapping out your organization's stakeholders and for determining the impact your organization would like to have on each of your identified stakeholders based on your data story.
Implementing Quality 202: Matching Data with Charts
Telling Your Story Through Data
Ingenuity, prepared by Jennifer Benoit-Bryan and Katherine Gean / 18/05/2018
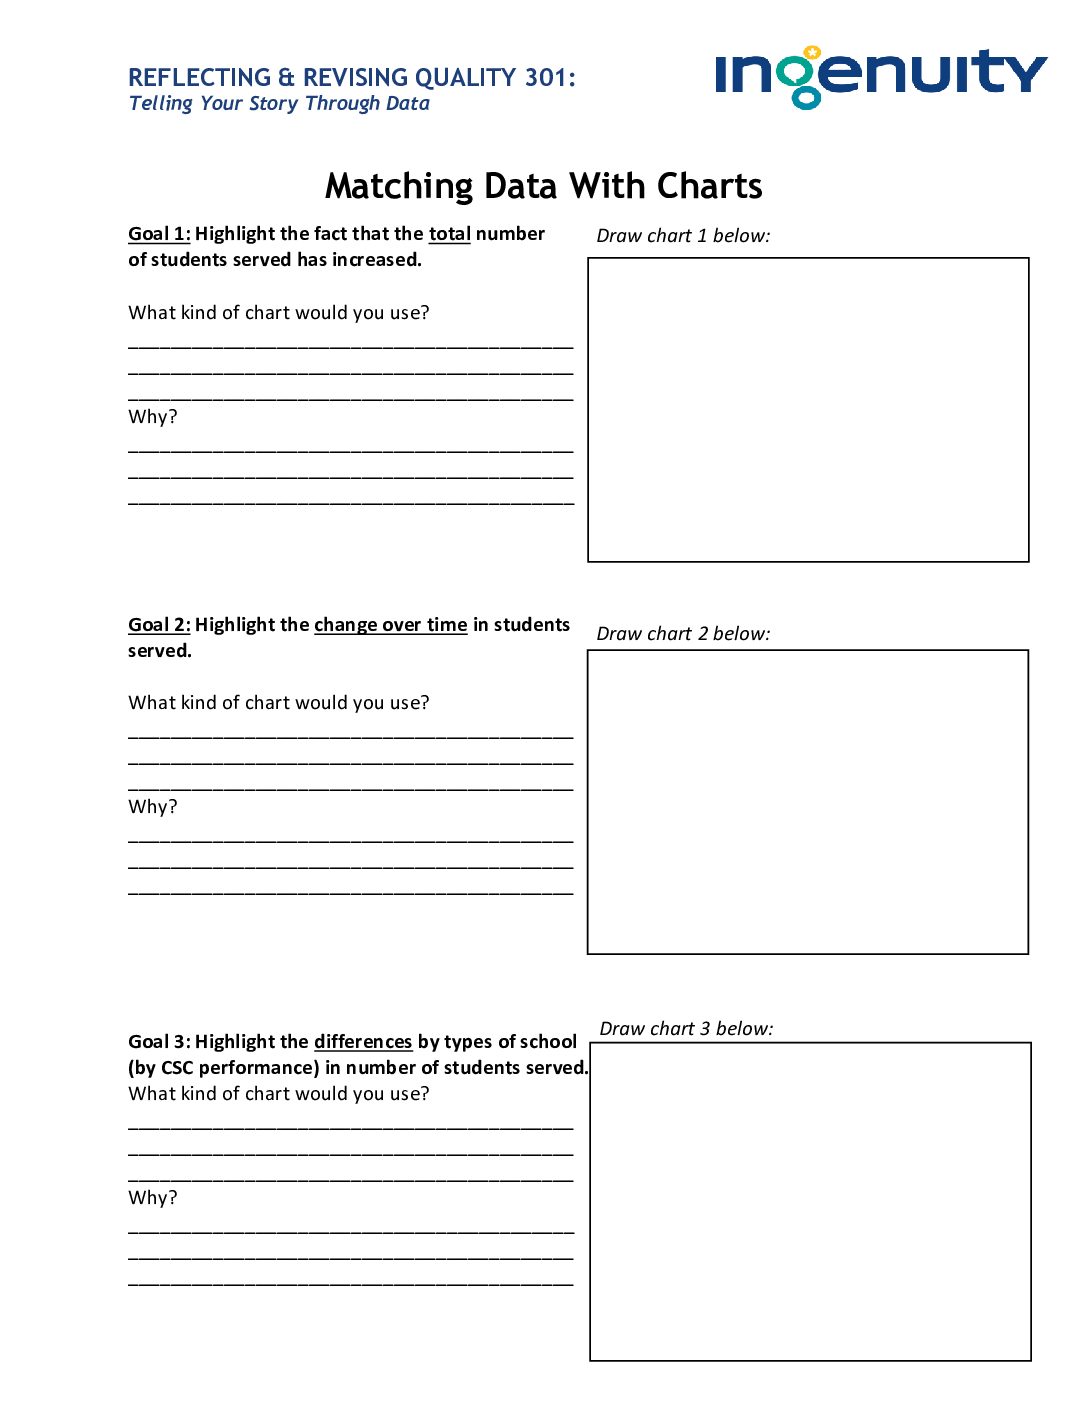
This worksheet explores the types of charts arts partners might use for illustrating total number of students served, change over time, and differences by types of schools.
Implementing Quality 202: One-Pager Principles Exercise
Data Analysis, Interpretation, and Visualization and Telling Your Story through Data
Ingenuity, prepared by Jennifer Benoit-Bryan and Katherine Gean / 18/05/2018
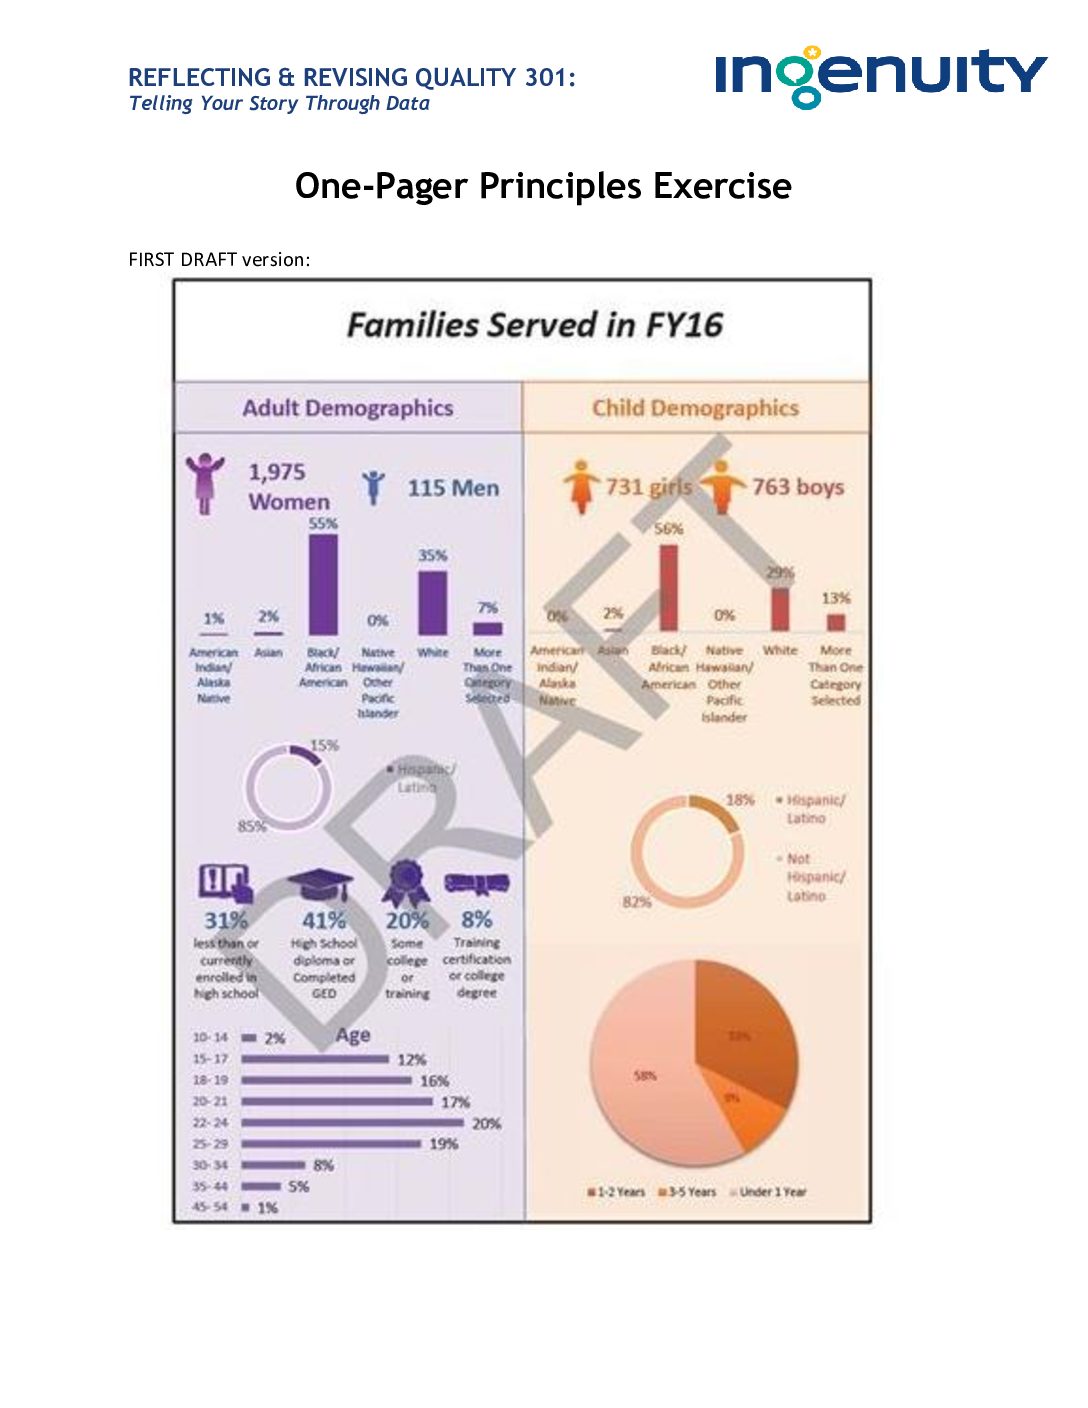
This worksheet illustrates two examples of one-pagers with the same data: an early draft and a mid-stream draft and ask the user to: identify what the main differences are between the two versions, and ask how might those differences contribute to their goal of quickly providing clear information.
Implementing Quality 202: Participant Agenda
Data Analysis, Interpretation, and Visualization | Telling Your Story through Data
Ingenuity / 18/05/2018
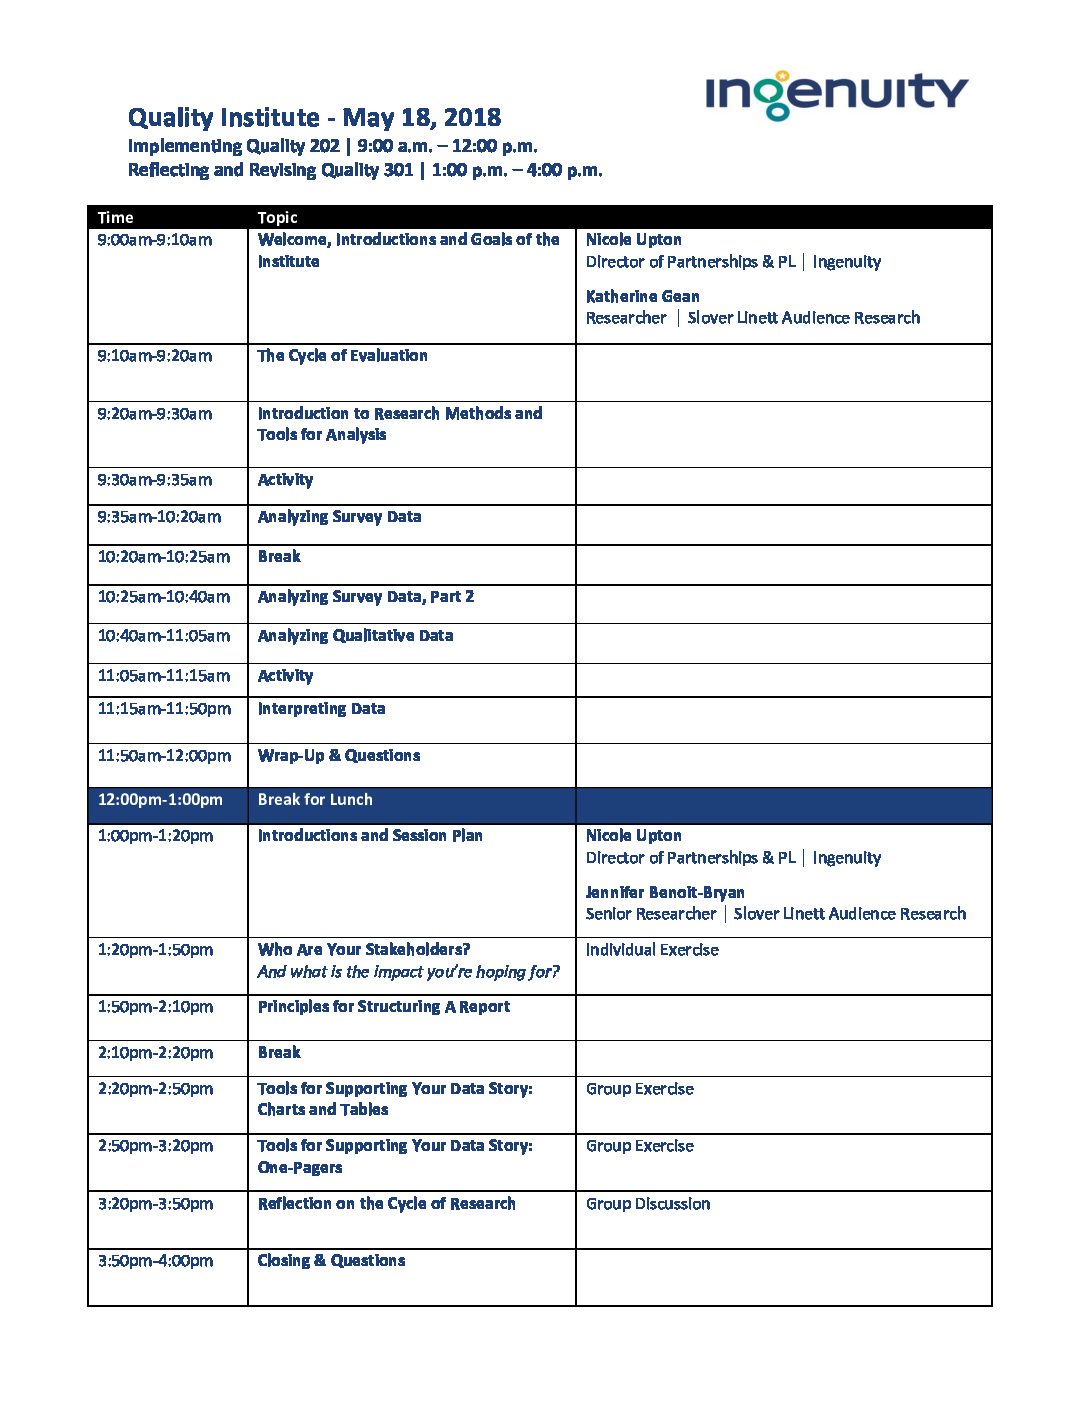
This is a session agenda from a Quality Institute: Implementing Quality and Reflecting and Revising Quality.
Ingredients for Differentiated Learning
CAEF Differentiated Learning
Ingenuity, presented by the Chicago Arts Educator Forum (CAEF) / 16/10/2015
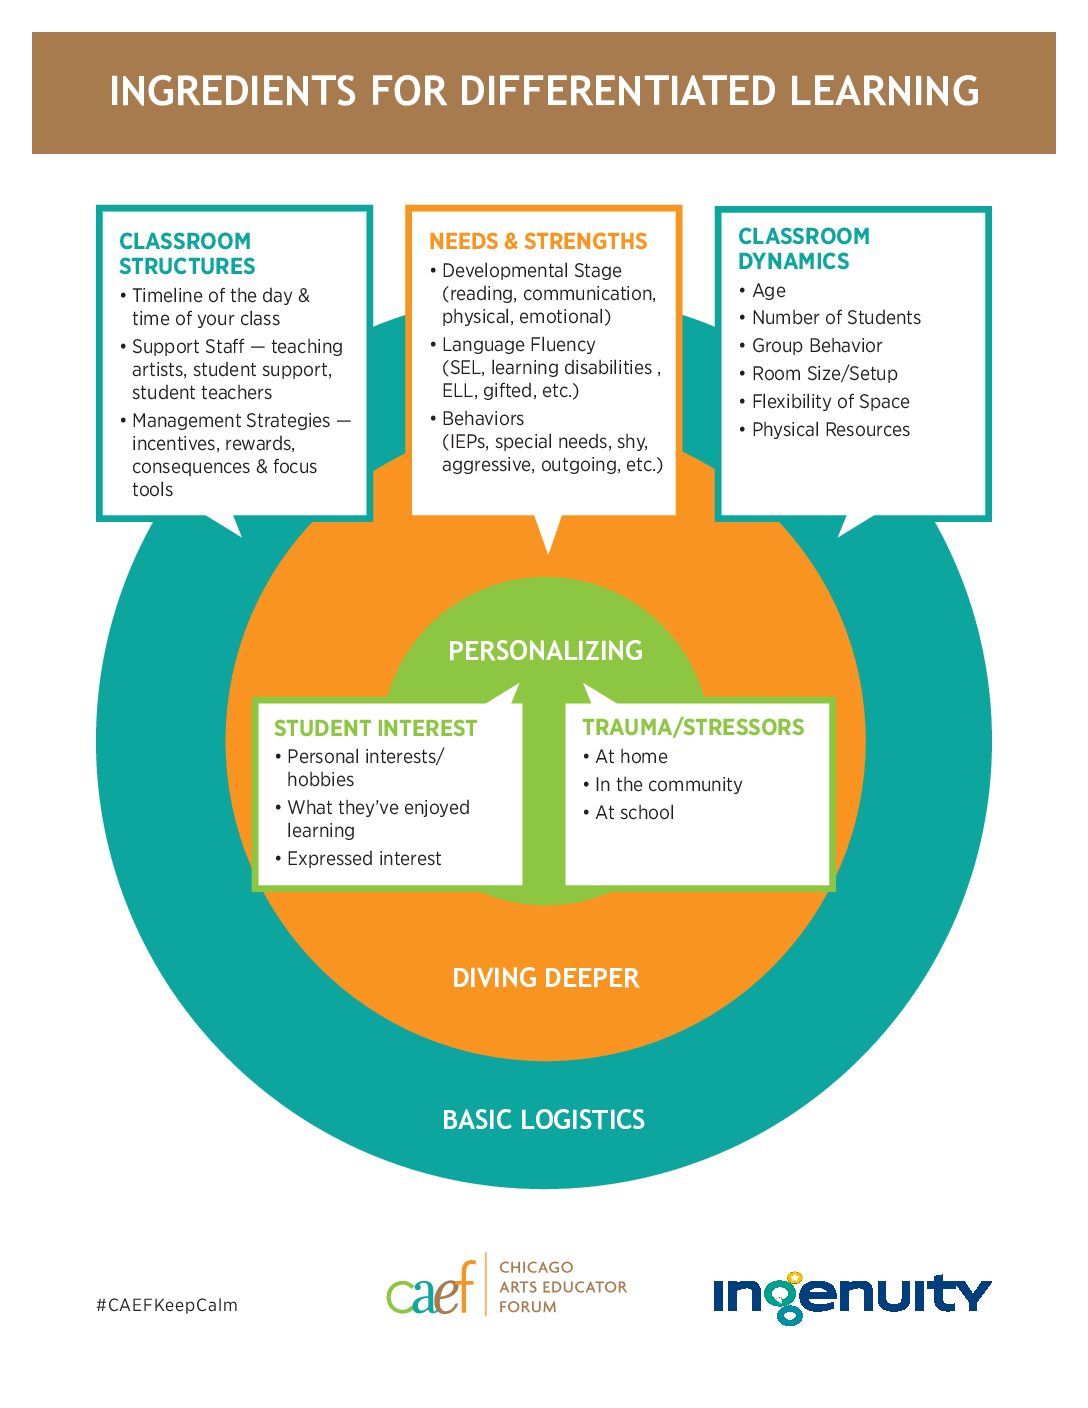
This tool outlines the necessary ingredients for successfully incorporating differentiated learning in the classroom by assessing the following areas: classroom structures, needs and strengths, classroom dynamics, student interest, and trauma/stressors. Additionally the worksheet provides an active template for strategizing on how to plan, implement, and evaluate progress in relationship to incorporating differentiated learning.
Integrate Educational and Artistic Practices – APSP
Ingenuity
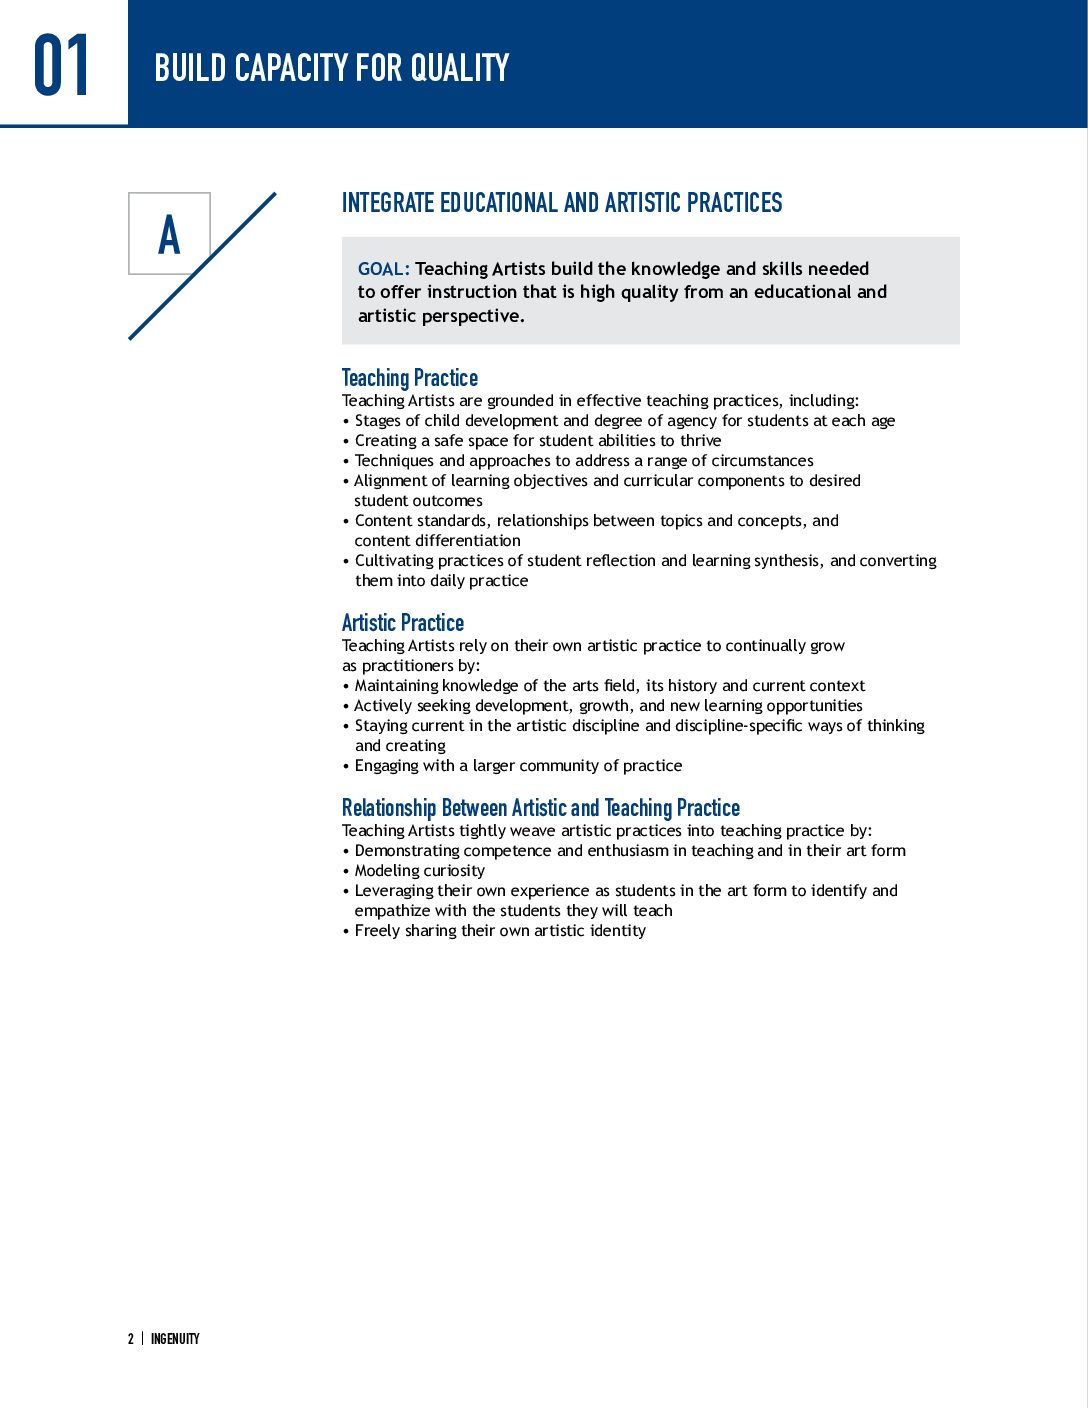
This section of the Arts Partner Standards of Practice provides an overview for component 1A of the Instructional Framework: Integrate Educational and Artistic Practices.
